There has been a lot of chatter on NextDoor and Facebook over the last few days about the effect of reducing Richmond’s Police Budget by 20%, as advocated by mayoral candidate Melvin Willis. Most people are dead set against a reduction in policing, while Melvin and a number of stalwart RPA members believe police funding should be transferred to other City activities, including youth programs and libraries. In fact, some believe that police actually cause crime! There has also been discussion comparing Richmond’s police budget to that of other cities on a per capita basis.
What no one is doing is looking at what the impact would be from a 20% reduction, and Melvin has put forth no plan of what his proposed 20% reduction would look like or what the results would be.
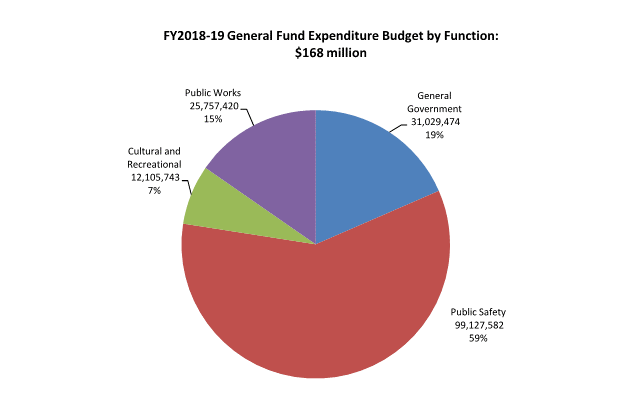
The answer is pretty easy to find. The Richmond 2018-19 General Fund budget of $168 million includes $58 million for Police (The total Public Safety budget, including the Fire Department is $99 million).
Richmond has already reduced the number of sworn officers from 196 in 2014-15 to 178 in 2018-19, a 10% reduction. A number of officers out on injury or other types of temporary leave makes the number even smaller. Nearly 80% of the department’s budget consists of sworn officers. Lopping 20% off the current budget would be about $12 million and would represent losing about 45 to 60 officers, leaving only 118 to 133. It doesn’t take a genius to figure out that beat coverage and response times would take a major hit.
Why do some cities have a lower per capita expenditure on police compared to Richmond? Because they have a much lower crime rate. The table below uses figures that are couple of years old, but it shows that the overall Richmond, CA crime rate is 45% higher than the California average and is 53% higher than the national average. Looking at violent crime specifically, Richmond, CA has a violent crime rate that is 106% higher than the California average and 138% higher than the national average. For property crime, Richmond, CA is 34% higher than the California average and 39% higher than the national average.
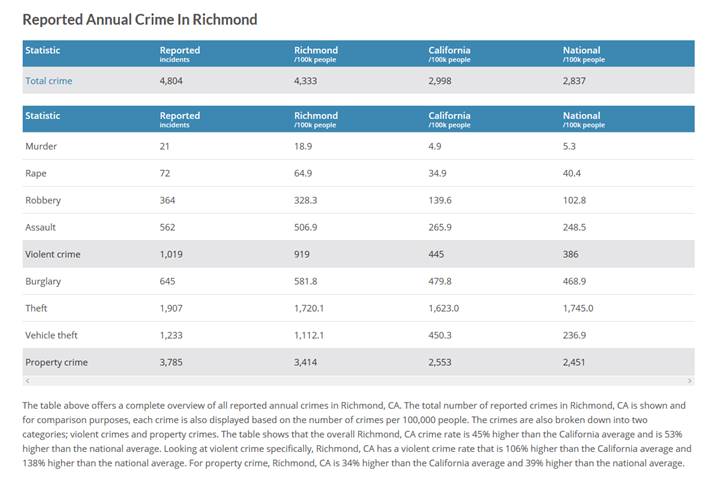
Figure 1 - Source www.areavibes.com
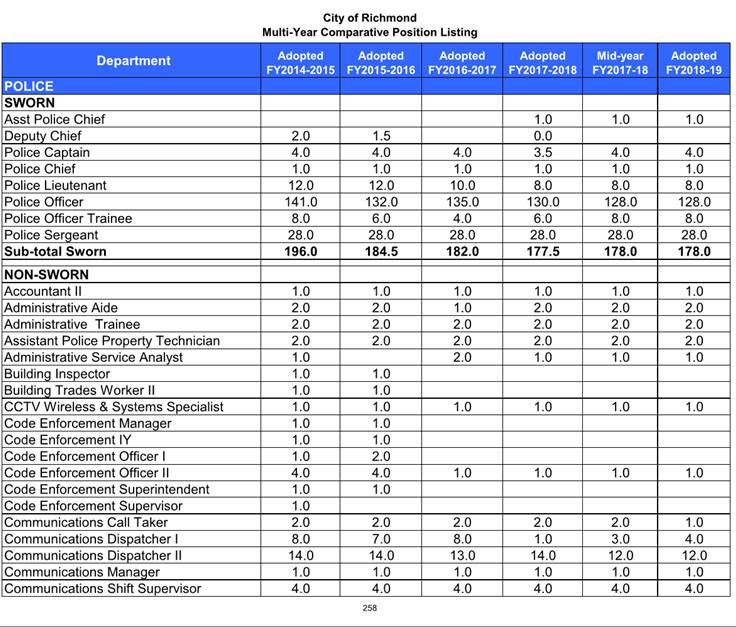
Figure 2 - Source 2018-19 Richmond Budget
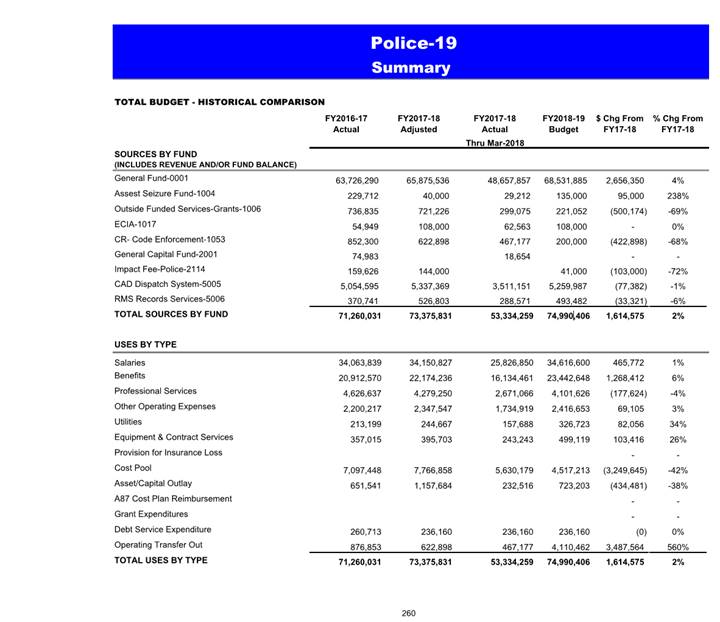
Figure 3 - Source 2018-19 Richmond Budget
|