|
| The mayor’s Office project to survey, map and evaluate the availaibity of healthy food to all residents has turned out to be complex and time-consuming project, but we are on the home stretch. Following is an article by a UC Berkley grad student who is one of more than half a dozen staff and interns who have worked on the project over the last three yaers.
https://food.berkeley.edu/from-the-field/data-food-cities-whats-connection-let-richmond-tell/Data, Food, and Cities: What’s the Connection? Let Richmond tell you
By Julieth H. Ortiz
Julieth H. Ortiz is a Dual Master’s Student, City Planning and Environmental Planning-Landscape Architecture, and a 2017 Berkeley Food Institute Community Engagement and Leadership Fellow.
The local health data that has become publicly available via the 500 Cities Project shows a higher prevalence of diseases such as diabetes, high blood pressure, obesity, stroke, and teeth loss in Richmond in comparison to other cities in California’s Bay Area.
While the availability of health data at smaller geographic scales is highly valuable, it is worth mentioning that existing quantitative data tends to superficially point out the many challenges in low-income communities, neither getting at the structural barriers that concentrate disparities in these communities nor accounting for what these communities are doing to address such disparities. The City of Richmond, for instance, has been pursuing community-driven initiatives and implementing policies to systematically improve community health and wellness in the City. As a Berkeley Food Institute Community Engagement and Leadership Fellow, I had the opportunity to join the Mayor’s office team on these efforts. They brought me onboard for data analysis, but also to provide assistance for developing the overall framework for presenting findings to community members and developing a report after receiving feedback from different stakeholders.
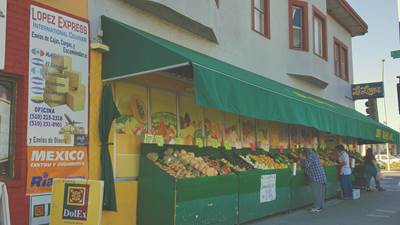
During the summer of 2016, the Mayor’s Office of Richmond launched a Food Census to assess the types of healthy food available to residents. The City adopted an observational tool developed by the California Department of Public Health, called the CX3 Food Availability and Marketing Survey, which aims to empower communities to collaboratively build healthier places to live, work, and play. The data collection was carried out by a small group of young volunteers and City staff who were trained by Contra Costa County staff. This team visited 50 food stores, from supermarket chains to convenience stores, and collected data on store interior and exterior; the acceptance of nutritional assistance programs such as WIC and SNAP; the quality, availability, and affordability of produce; and lastly, the availability of other healthy foods.
In addition to the inter-agency and multi-generational collaboration that defines this effort, another unique characteristic of the Food Census is its focus on health. It is one of many city-wide initiatives that addresses the social determinants of health; its core vision is to implement strategies that tackle health disparities, particularly diet-related chronic diseases. While such strategies have great potential to promote health equity, they remain under-supported because of limited resources and competition with other political interests.
Some findings from the Food Census thus far include:
- Promotion of Healthy Foods. Most stores scored lowest in questions that asked about healthy marketing practices inside the stores, especially around produce display. Healthy marketing around produce display included promotion of sustainable packaging practices, nutrition information and participation in the Nutrition Education and Obesity Prevention Branch (NEOPB) Champions for Change Program, to name a few. Stores could also get points if there were participants of NEOPB Healthy Retail Program. Data collectors found that the majority of stores in Richmond are not aware of and therefore do not participate in such programs. The Healthy Retail Program offers support to qualifying food stores through policy, systems, and environment strategies. Some examples of these are free trainings, marketing materials, tasting demos, assistance for facade improvements, etc.
- Affordability of Produce. The price of fresh fruits and vegetables in local stores are higher than the “cut points” for citywide prices, and even higher than the cut points for county prices. The cut points or reasonable prices were calculated by averaging the price of produce items from supermarkets chains and adding a 10% margin to this average. Given that most stores in the City are small markets, it becomes challenging for store owners to compete with prices from larger food stores. Results from a questionnaire that the City also conducted to store owners last summer show that 13 out of 22 stores said they were either very interested or interested in offering produce if financial assistance became available.
- More Healthy Food. Beyond the availability of produce, the surveys document what other types of healthy foods are available. The stores in Richmond scored very close to meeting standards for this section, showing that while fresh produce is not as affordable, there are other options for healthy food available to residents. Perhaps gaining a better understanding about culturally-relevant foods can help expand on what is considered healthy today.
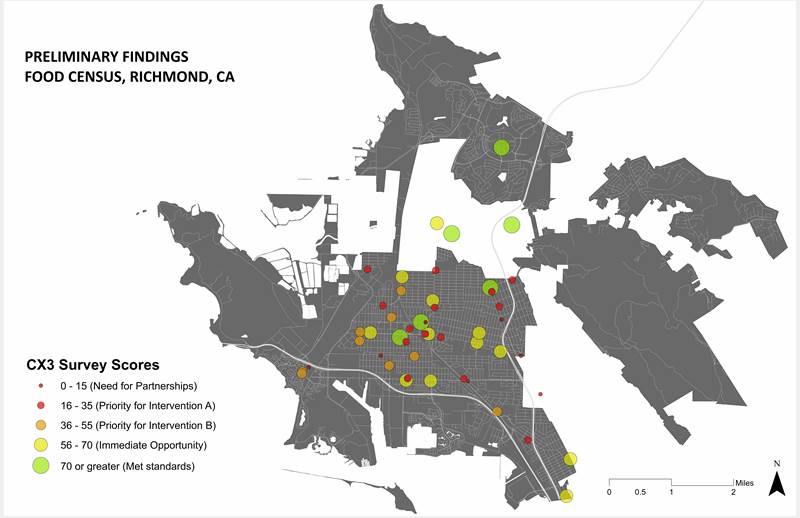
CX3 Food Availability and Marketing Survey Scores (n=48 stores). Only 7 out of 48 stores met standards, 4 of them are chain supermarkets, one of them holding the highest score of 78 points. Most of the stores scored between 16 and 35 points (small red dots). Within City limits, 2 small markets met standards with scores of 70.5 and 73, respectively.
CX3 Food Availability and Marketing Survey Scores (n=48 stores). Only 7 out of 48 stores met standards, 4 of them are chain supermarkets, one of them holding the highest score of 78 points. Most of the stores scored between 16 and 35 points (small red dots). Within City limits, 2 small markets met standards with scores of 70.5 and 73, respectively.
What’s next?
These scores will be used to prioritize strategies for intervention that go beyond increasing food availability, and for building partnerships to support existing food outlets. For the Mayor of Richmond’s Office, it is important to understand that just looking at what is available at food stores in their low income neighborhoods is not enough. When it comes to access, affordability as well as awareness are bigger challenges to addressing the root causes of health inequities.
Research shows that 70%-80% of factors that affect racial differences in longevity are socio-economic and demographic—not genetic—with income as the most significant determinant. The phrase “poverty gets under the skin” speaks to the “biological embedding” of social status, where experiences of poverty and racism are often the underlying causes behind poor health by making a person more vulnerable to disease and infection.
A second economic aspect tied to health inequities is one of location. Some of the stores that were assessed and met standards are actually situated within half a mile outside of Richmond’s boundaries. These stores are indeed meeting the need of Richmond’s residents, yet tax revenues go to neighboring cities, further limiting resources that could be invested in providing a food landscape that is more affordable and has healthier options to residents.
The scores themselves don’t necessarily teach about the importance of food to a community, or ultimately what kinds of foods are accessible to families. However, they do tell a story about local efforts for understanding community’s health needs and their food environment. Data needs to accurately capture the barriers to accessing healthy food options in order to improve health outcomes in communities like Richmond. However, how can cities like Richmond understand constituents’ needs better through data processes (i.e collection, analysis) with such limited resources? This conundrum remains, and I hope future fellows will be able to work with Richmond’s hardworking citizens and public servants to work creatively around these challenges.
|